Well, the “Main Stream” and conventional “experts” have been all aglow reporting the “death” or “crash” of Bitcoin and the alt-coin market. Several stories gloating with a “see, I told you so” tone, due to the downturn of the price of Bitcoin. Was it a crash? Was it a correction? Was it nothing at all? You decide.
In December of 2016 the “experts” were not even thinking about Bitcoin. The price on December 7, 2016 although lower, began what appears to be a seasonal change in daily percentage of price change to the previous day.
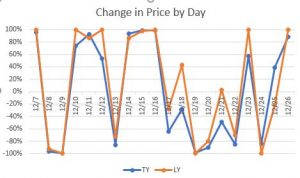
The Percentages while different follow a daily pattern. Perhaps the “crash” is simply a historical trend.

Graph of the Pct change in daily closing price of Bitcoin 2016 vs 2017
Data
| Timestamp | Close | Pct Chg | Timestamp | Close | Pct Chg |
| 12/6/17 | 13556 | 12/6/16 | 754 | ||
| 12/7/17 | 16609 | 22.521% | 12/7/16 | 760.8 | 0.902% |
| 12/8/17 | 15841 | -4.624% | 12/8/16 | 762.205 | 0.185% |
| 12/9/17 | 14661 | -7.449% | 12/9/16 | 762.1 | -0.014% |
| 12/10/17 | 14914 | 1.726% | 12/10/16 | 766.61 | 0.592% |
| 12/11/17 | 16810 | 12.713% | 12/11/16 | 759.5 | -0.927% |
| 12/12/17 | 16972 | 0.964% | 12/12/16 | 766 | 0.856% |
| 12/13/17 | 16179 | -4.672% | 12/13/16 | 771.69 | 0.743% |
| 12/14/17 | 16384 | 1.267% | 12/14/16 | 771 | -0.089% |
| 12/15/17 | 17523 | 6.952% | 12/15/16 | 770.53 | -0.061% |
| 12/16/17 | 19186 | 9.490% | 12/16/16 | 771.1 | 0.074% |
| 12/17/17 | 18968 | -1.136% | 12/17/16 | 776.01 | 0.637% |
| 12/18/17 | 18935 | -0.174% | 12/18/16 | 779.443 | 0.442% |
| 12/19/17 | 17342 | -8.413% | 12/19/16 | 778.5 | -0.121% |
| 12/20/17 | 16433 | -5.242% | 12/20/16 | 783 | 0.578% |
| 12/21/17 | 15650 | -4.765% | 12/21/16 | 822 | 4.981% |
| 12/22/17 | 13173 | -15.827% | 12/22/16 | 844.5 | 2.737% |
| 12/23/17 | 14035 | 6.544% | 12/23/16 | 885 | 4.796% |
| 12/24/17 | 13480 | -3.954% | 12/24/16 | 878.2 | -0.768% |
| 12/25/17 | 13627 | 1.091% | 12/25/16 | 863.11 | -1.718% |
| 12/26/17 | 15688 | 15.124% | 12/26/16 | 879.59 | 1.909% |